Generally speaking, the expected move of a stock is the amount that a stock is expected to either rise or fall from its current market price based on its current level of implied volatility. In a nutshell, Implied volatility is the market’s forecast of a likely movement in the stock price.
An expected move, wether directional or non-directional, reflects what the options market is pricing-in.
If you’re bullish on a certain stock, the upward expected move is the amount of upward stock move you would need to be profitable with an options position. To calculate this market move, we usually look at the closest at-the-money strike call break-even (and put for a bearish thesis).
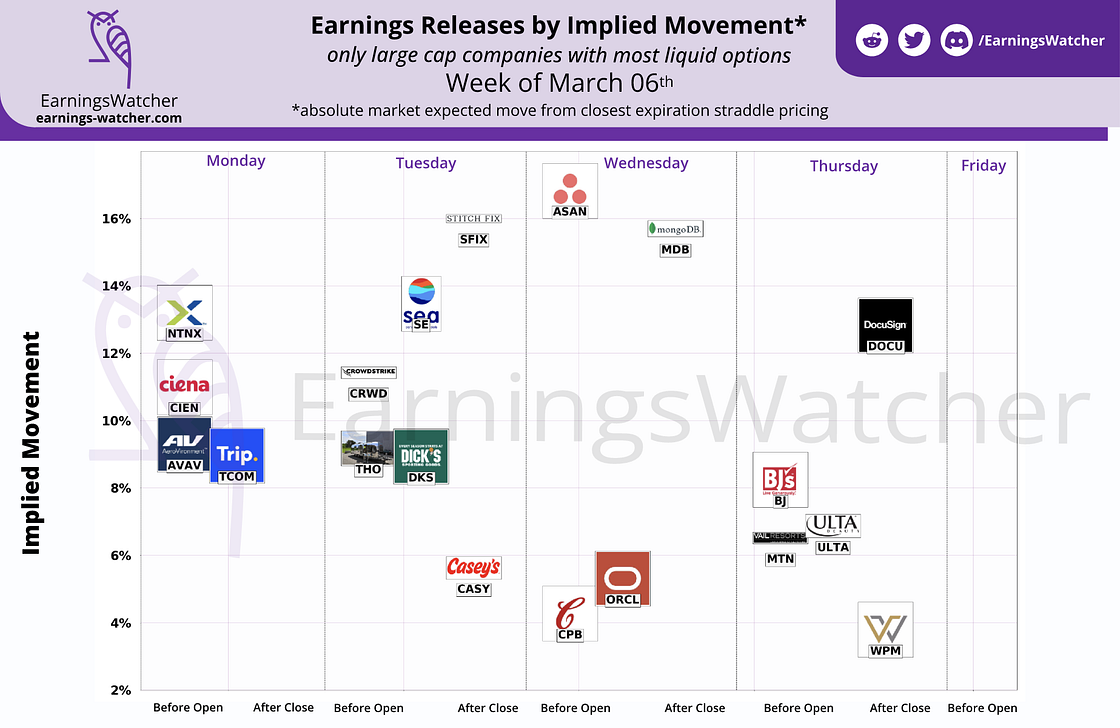
For earnings, it is more conventional to look at absolute moves, and for this, the classic position break-even investigated would be the closest expiration straddle. These are the values you find in our weekly earnings calendar:
For an option trader, it is very important to know the projected behaviour of any position, with metrics — like delta that represents sensitivity to the underlying price.
One of the most paramount values to have in mind is the position break-even, ie how much move in the stock is needed for the position to be profitable.
In an earnings context, it is interesting to benchmark that break even against nominal values: what moves happened in the past during earnings (the last move, average move, ..) and current market expectations: the implied or expected earnings move.
A quick way to approximate the expected move of a position is a to add the leg prices and divide by the stock price at entry.
This will actually give the break even at expiration of the position, as it only takes into account the intrinsic value of the position: no matter what IV is by then, this is where the stock needs to be for the position to be worth its initial price.
Let’s take an example:
DKS releasing earnings March 07th before market open, so first trading day after release is March 07th — this being written on March 06th.
We are interested in the first expiration after release, so that’s the weekly options expiring on 03–10. Stock price at the time this is written is ~$132.5, so closest straddle is the 03–10 133p 133c
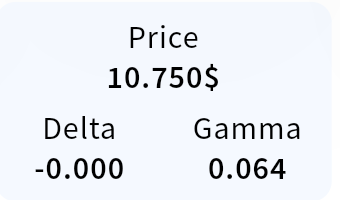
The break-even at expiration is then 10.75/ 132.5 = +/-8.1%.
This can be a first approximation of the implied move for DKS.
DKS earnings are however on Tuesday, so we can expect that the real actual break even for our straddle will be a bit lower than the expiration one since theta would have less impact by mid week.