Today we'll be discussing positions for a long volatility strategy during earnings. We'll review the specific positions we typically consider, discuss calibration methods, outline our targets, and focus especially on our exit strategies.
The goal is to prepare ourselves ahead of time so that we're not caught off guard emotionally and can avoid reactive decisions.
We'll use Morgan Stanley's recent earnings as an example.
We'll delve into how these positions were set up, how they performed, and how we managed their calibration and exits.
Although this is a long volatility example, the same process can be applied to short volatility.
Let's dive right in and start by reviewing some of the signals indicating why Morgan Stanley was a strong candidate for long volatility strategies.
Long volatility, in essence, involves betting that the actual stock movement on the day following earnings release will exceed the movement implied by the market.
This strategy isn't just directional; it encompasses non-directional positions involving both call and put options. The goal is to identify positions where actual volatility surpasses what's priced in.
To assess this, we compared the current implied volatility (before earnings) against historical earnings moves.
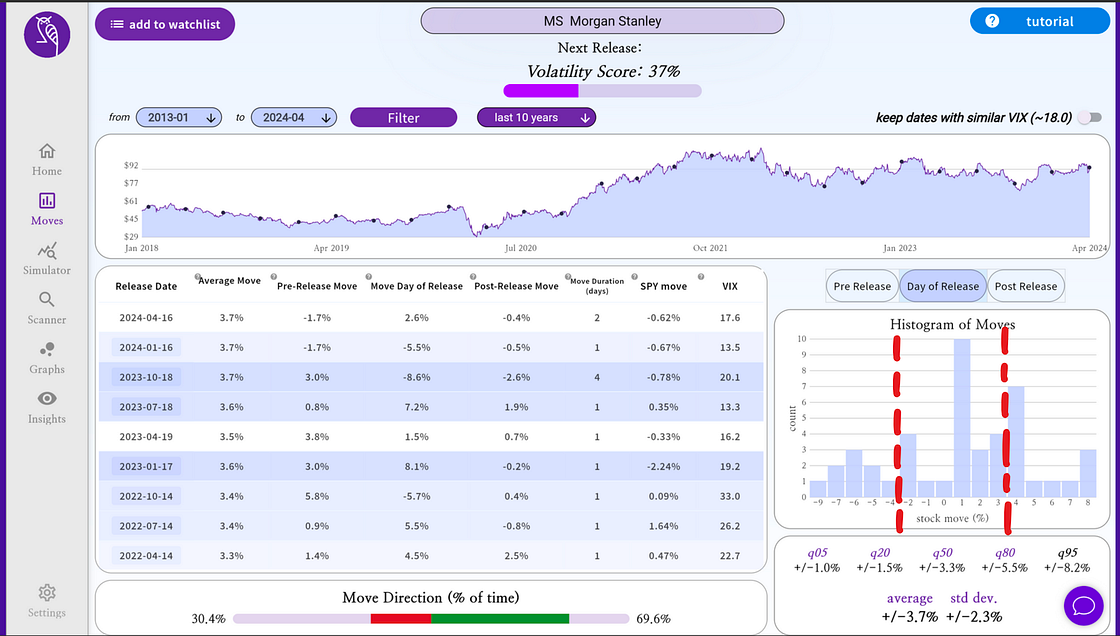
Our analysis, using the Moves Analyzer on the Earnings Watcher platform, revealed a recap of past earnings moves that caught our interest.
Specifically, we're focusing on the central column of data excluding the most recent earnings.
Looking at previous earnings releases, we observed substantial movements: −5.5%, 8.6%, and 7.2%.
This pattern suggests a generally volatile stock, with the smallest move over the last two years being 1.5%.
Prior to the recent earnings, the implied move for Morgan Stanley was approximately ±4%.
These historical trends indicate potentially undervalued volatility, making the setup favorable for employing long volatility strategies with Morgan Stanley.
In the histogram, we have a graph illustrating the distribution of moves observed in this column. The x-axis represents the value of the move, while the y-axis shows its frequency or count.